| Performance Measurement Basics |
| As a very simple example, consider the following.
If you invest $10,000 today in a particular mutual fund and it is worth $12,000 exactly 2 years later you can describe your investment performance in several ways.
Each of the above is an accurate description of performance, but the first two don't take the time period into consideration. In fact, if you reduced the interval to 6 months, the first two statements would remain true. However, the third statement would change to indicate an annualized rate of return of 44%. This example involves a single transaction only. In many cases, securities are bought and sold more than once in an investment period. In these cases, multiple transactions have to be considered when calculating performance. Portfolio Professional measures performance by comparing the amounts invested with the value of these investments at various points in time. Growth or loss for an investment can be described in any of the following ways as in the previous example.
Measuring volatility (or risk) in your portfolio is equally as important as measuring performance. Portfolio Professional compares the volatility in your individual investments by analyzing their monthly performance results over various periods of time. The following sections provide additional details for each of the topics above. For example, if the value of mutual fund X was $5000 last year and is $8000 today and you purchased $2000 worth of the fund within the last year, the Total Net Dollar Gain for the 1 year period is $1000. Similarly, if the value of mutual fund X was $5000 last year and is $6000 today and you sold $2000 worth of the fund within the last year, the Total Net Dollar Gain for the 1 year period is $3000. Total Net Dollar Gain = Forward Value - Total Buys + Total Sells or alternatively Total Net Dollar Gain = Realized Gain + Unrealized Gain Simple ROI % = Total Net Dollar Gain / Total Buys Each cashflow is essentially a dollar amount (A) that has a term in years (t) to the end date. The sum of their forward values using the average compound rate can be expressed as follows.
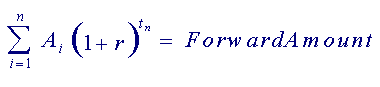 The rate of return that is calculated and reported in Portfolio Professional is the solution to the above equation for r when the A's, the t's and the forward amount are all known. This method of measurement is the most useful when comparing investments with varied cashflows and durations. Rate of Return is always annualized. Compounding frequency can be annual (recommended), semi-annual or daily. The default frequency is annual but this can be changed using the preferences screen within the application. Lifetime performance is determined from the most recent value and all earlier transactions. Interval performance is determined from the current value and a previous value. Only the transactions falling between today's date and the previous date are considered. For example, assume that $10,000 was invested several years ago in mutual fund X and also in mutual fund Y and that today they are each worth $15,000. Perhaps the value of mutual fund X varied considerably, at some points as low as $7,000 and at other points as high as $17,000. If the value of mutual fund Y grew steadily from $10,000 to $15,000, it's computed volatility would be significantly lower than that of fund X.
Volatility is often used to quantify risk. It is important to consider how much risk you are being subjected to when you compare investment performance. Volatility calculation allows you to compare your investments in terms of risk as well as performance as shown below.
|