
![]()
|
Screen Shot - Distribution Graphs for Scoring
Statistics
|
|
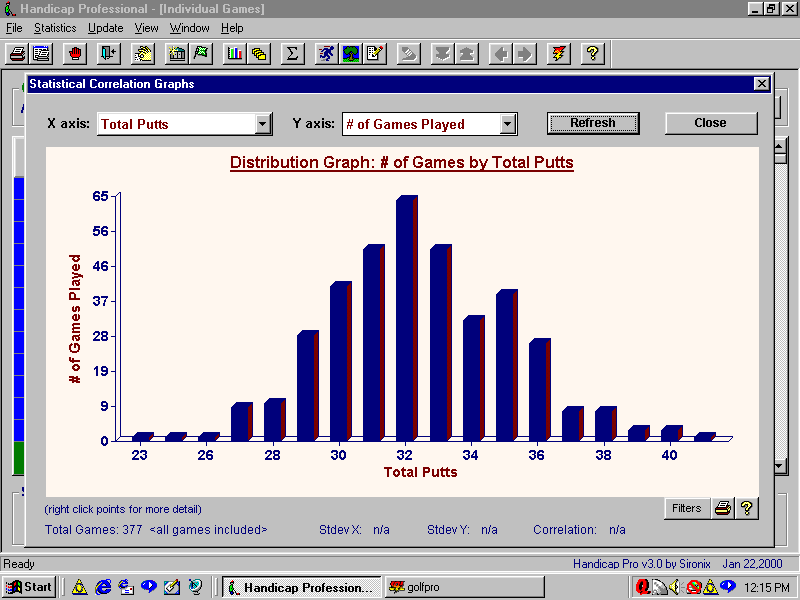
You can use this screen to view distribution graphs for each of
your scoring statistics. Distribution graphs illustrate your typical results
in each of the statistical categories. The degree of clustering around your
typical value is an indication of your consistency. In the example below, total number of putts per round is graphed. Out of the total number of rounds played, you can see how many times this golfer took 31 putts, 32 putts, 33 putts etc. |
![]()

Home Overview
Features Screen Shots Downloads
Purchasing FAQ's System Requirements Technical
Support Contact Us
![]()